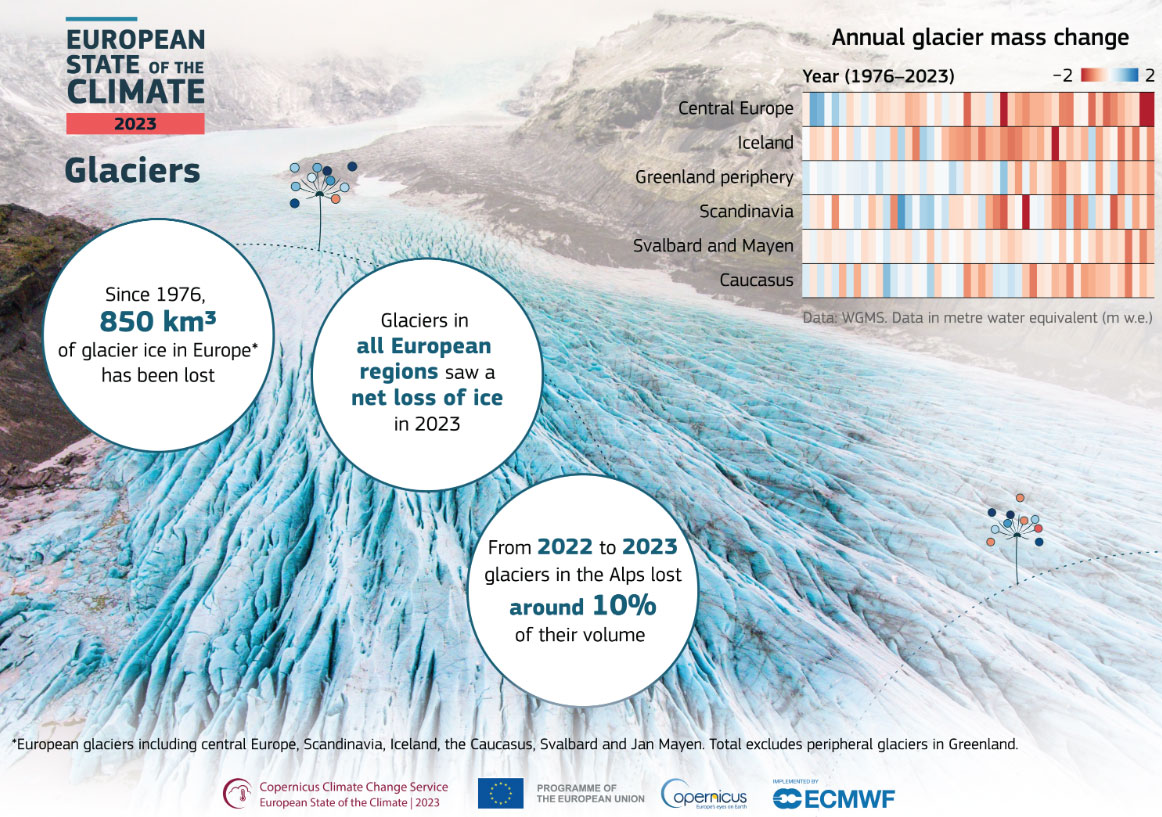
In 2023, Europe experienced some of its most extreme weather events on record, with soaring temperatures, devastating wildfires, and widespread flooding. Glaciers across the continent also faced significant ice loss, particularly in the Alps, where ice volume decreased by approximately 10% compared to the previous year.
The European State of the Climate Report for 2023, produced by the Copernicus Climate Change Service (C3S), a service implemented by ECMWF on behalf of the European Commission, in collaboration with the World Meteorological Organization (WMO), provides a detailed analysis of Europe’s climate trends and highlights key findings from the past year.
The report’s eye-catching cover hints at its innovative approach to presenting science in an accessible manner from the start. Depicting flowers with petals in varying shades of red and blue – inspired by Ed Hawkins’s climate stripes – it represents real temperature anomalies in Europe since the 1980s, where each color gradient tells a story of changing climate patterns. “The last petal, 2023, is flowing away towards an unknown future. Where are we heading to?” writes Anna Lombardi, climate data visualizer at C3S.

Throughout the report, readers can find a wealth of interactive graphics, maps, and animations, designed to make complex climate data accessible to all, thanks to cutting-edge data visualization techniques that enhance the report’s impact and reach. In this interview with Lombardi, we delve into the insights, challenges and opportunities surrounding effective data visualization.
The data visualizations in this report go beyond simplified technical plots, incorporating artistic elements like the cover image and interactive features. How do these elements contribute to the overall impact of the visualizations?
The cover image was designed to be an example of pure data visualization: based on real temperature data for Europe but transformed into a visually pleasing and eye-catching product, serving as a visual hook to engage more people from various backgrounds. I aimed to spark curiosity and draw people into exploring the report further. This strategy was proven to be effective, as many retweets came from diverse audiences beyond the usual climate-focused circles, indicating broader engagement with the content.
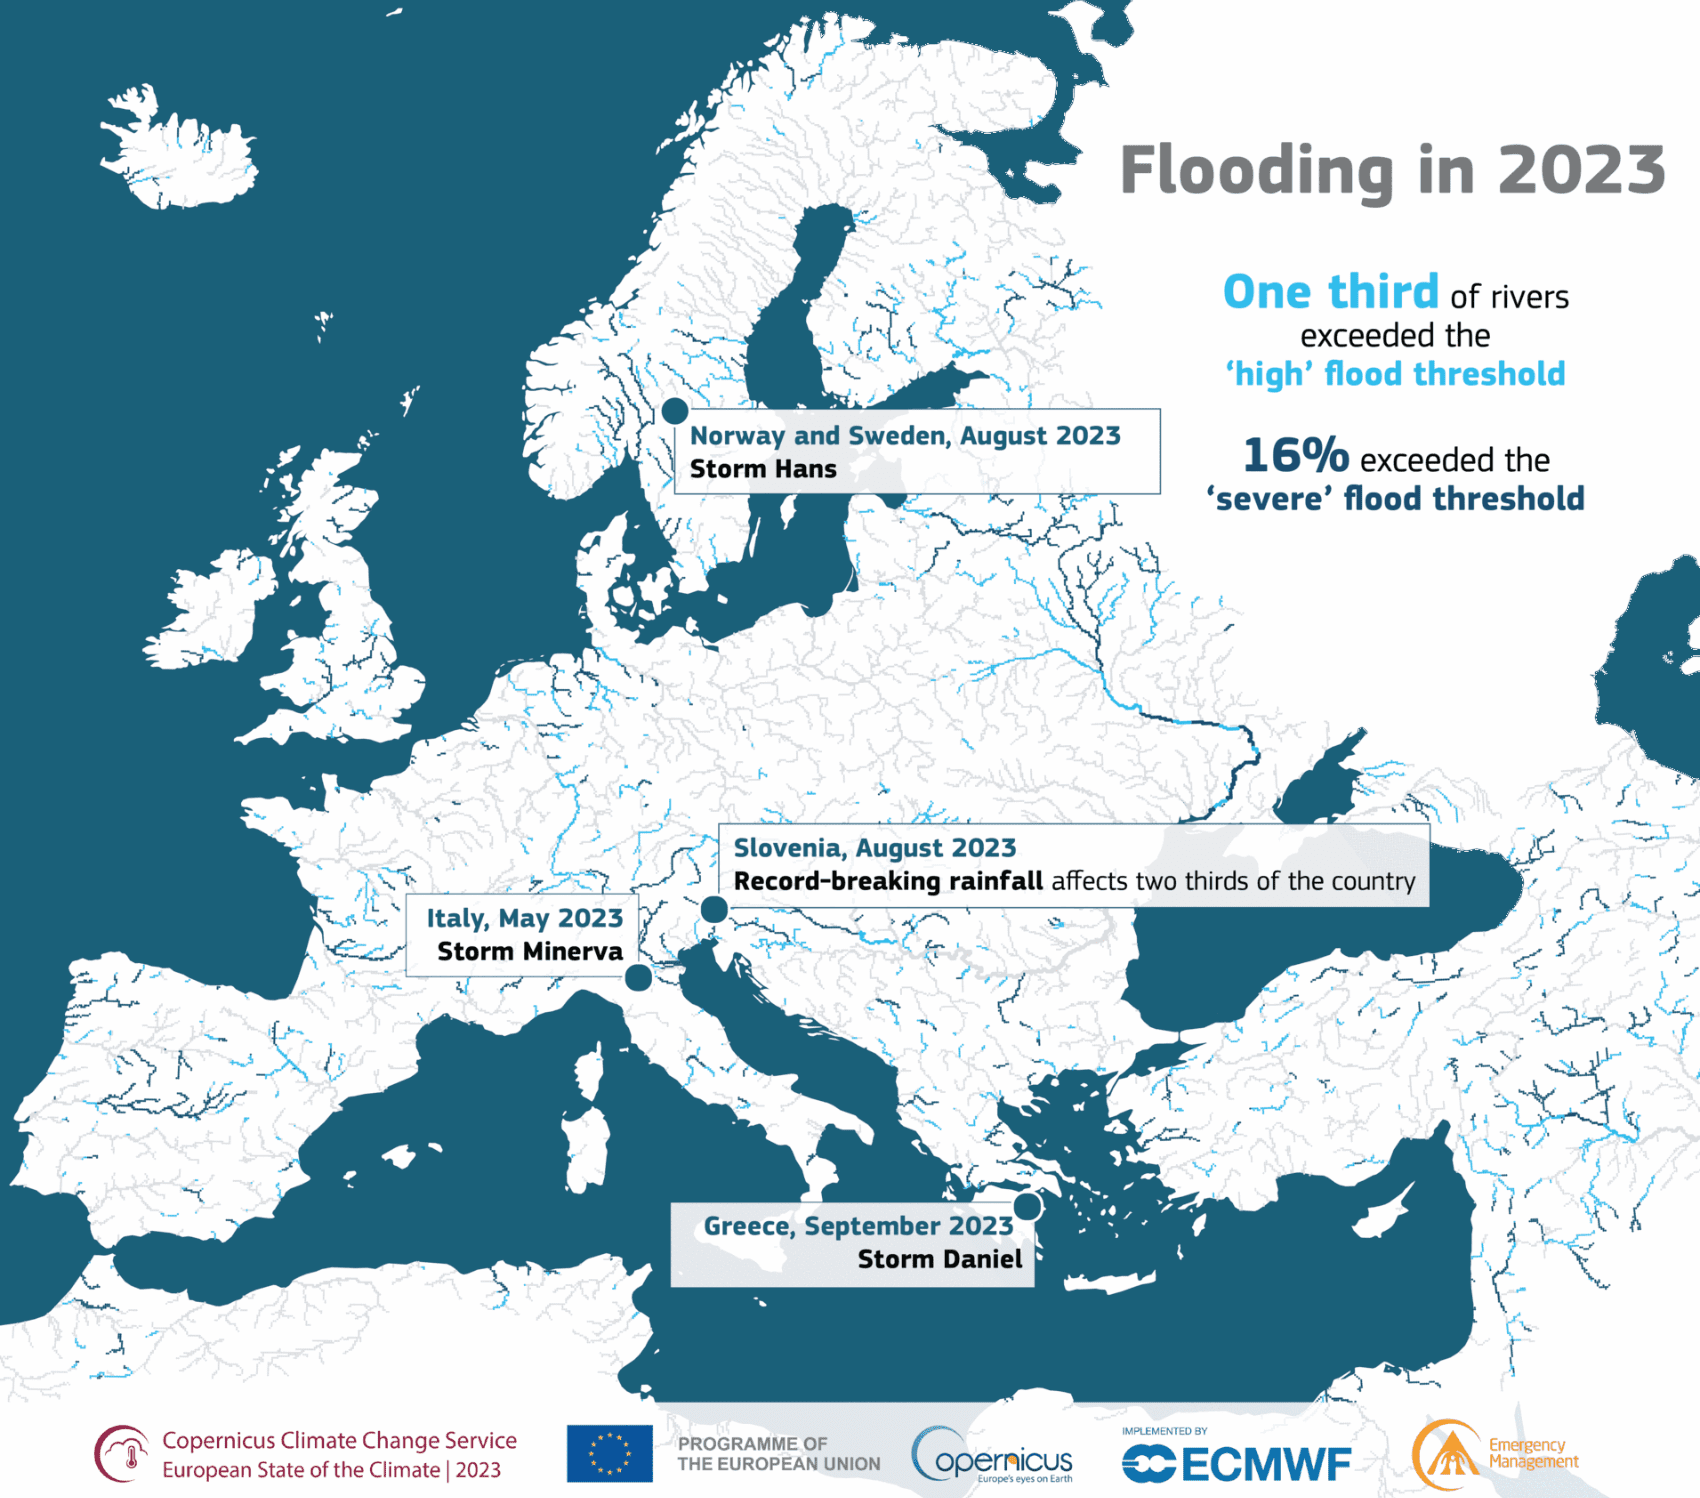
We also developed an interactive map of the key climate events in 2023 to allow users to navigate such a huge amount of information at their own pace and focusing on the area or events of greater interest to them. To improve user experience and overcome navigation issues, especially on mobile devices, we decided to change the default view on mobile to a timeline. We also added filters to allow users to explore by month or event type, prioritizing user-friendly design and focused information access.
Why does C3S put so much emphasis on data visualization?
The Copernicus Climate Intelligence team coordinating the production of this report conducts in-depth analyses of historical climate data up to the present day. They track the evolution of climate on both European and global scales meticulously, examining a wide range of factors including temperature, oceanic conditions, ice coverage, and many more parameters, therefore offering a comprehensive understanding of ongoing climate trends through various products. For example, the monthly Climate Bulletin provides a detailed overview of the preceding month, while the annual Global Climate Highlights report offers insights into the previous year. Across all these products, data visualization is key in communicating such crucial information in a more engaging and memorable way, reaching the largest possible audience.
The 2023 State of the Climate report, undertaken for the first time in collaboration with the WMO, represents a significant milestone and an ambitious endeavor of the team. It includes contributions from diverse sources, including research centers, universities, meteorological agencies, and individual researchers. Contributors supply sector-specific highlights, data and analysis and the C3S editorial team is then in charge of homogenizing the content both in terms of text and visuals.
What was the main goal?
In my view, improving the report through data visualization was a way to reach diverse targets and to further engage new audiences, beyond the boundaries of the scientific community and outside the climate bubble.
We crafted an overall summary of the report, highlighting the key messages and including visually appealing, standalone graphs to encourage wider readership. A high number of charts were also picked up off-the-shelf by media outlets, including the Financial Times, the Guardian, and the BBC.
By distilling key points and providing data alongside each graph, we essentially simplified much of the media’s work. It resulted in an increased uptake of our graphs and improved social media engagement. Our wide offer of data visualizations was also intended to exemplify how people can explore Copernicus’ data and use them to explain our changing climate.
What were the main improvements introduced this year?
This year, our main objective was to overhaul the report’s visual presentation, create a consistent visual identity and streamline navigation through its different parts. We have also simplified and redesigned the main homepage and icons for each section.
A significant aspect was standardizing all visual elements such as graphs and maps. Until last year, most graphics and visuals of the report were provided by each contributor in their own style which led to the report somewhat lacking a cohesive identity. This time, we decided to create a style guide to share with external contributors early on in the preparation of the report. This ensured consistency in visual output by providing guidelines on color palettes, fonts, title alignment, and other basic design elements. Additionally, graphs used to be static in previous editions of the report, making them difficult to navigate and to read on mobile devices. As over 70% of views now happen on smartphones, we ensured that most graphs were interactive and responsive to different screen sizes.
What was the collaborative process with the scientists?
Some of the scientists and external contributors have been really responsive and provided clean data readily available for visualization. In total, we produced over 200 visual elements. Our main focus was to enhance accessibility – this involved translation, simplification, and emphasizing key points in each one, while ensuring scientific accuracy was preserved. The first step of the process was usually discussing with each contributor their intended message. The constructive exchange that followed allowed us to reach a final version that was more accessible and user-friendly while still accurately conveying the scientists’ findings.
I was pleasantly surprised by how well-received the suggestions to improve the design and layout were by the great majority of scientists, especially when it came to data visualization. When presented with an alternative version of their graphs, most recognized the added value of a refined design. As always, it requires a delicate balance of compromise, and ongoing dialogue in refining scientific communication that is able to reach broader audiences.
What further innovations would you like to implement in the future?
I would like to keep working with the editorial and communication teams to contribute to adding more interactive features and data visualization to our communication products. An example could be sliders to show before-and-after comparisons for specific regions. With many Copernicus satellite images at our disposal, this could be particularly interesting to visualize wildfires, floods, and the retreat of glaciers. This visual approach could serve as an effective promotion for the report, especially on social media platforms where such content is increasingly popular. By incorporating interactive elements like this, the report could be even more engaging and accessible to a wider audience, ensuring it’s not just seen as a technical product solely targeted to scientific circles.

Dr Anna Lombardi is a climate data visualizer at the Copernicus Climate Change Service, which provides climate intelligence information for a broad audience encompassing policy makers, meteorological agencies, the press, and the general public. She holds a PhD in experimental physics from the University of Lyon, France, and has a three-year experience as a postdoctoral research associate in the field of nanophotonics at the University of Cambridge, UK. In 2018 she obtained a MSc in science communication from the International School for Advanced Studies in Trieste, Italy. Before joining Copernicus, she worked as a senior data and graphics journalist at The Times and The Sunday Times in London for five years.
Read more:
- Visualizing climate science
- Scientists and journalists unite: the teamwork of climate change communication
Cover image: Surface air temperature anomalies in 2023. Credits: Copernicus Climate Change Service